See how you score against your competitors
Do you know how your website scores compared to your competitors? We measure it. With EEG and eye-tracking we compare the digital experience objectively, step by step through the journey.
Part of ![]()

A fair comparison. Right down to the feeling.
You want to make choices based on real data, not assumptions. So we measure how users experience your site, and your competitors'. We look at attention, cognitive load and emotion. That way you see not just what people do, but what they really feel.
- Natural behaviour, objectively compared
Users move through your site and your competitors’ on their own, without interruptions. The same task, the same participants, the same measurement. So the difference you see is real.
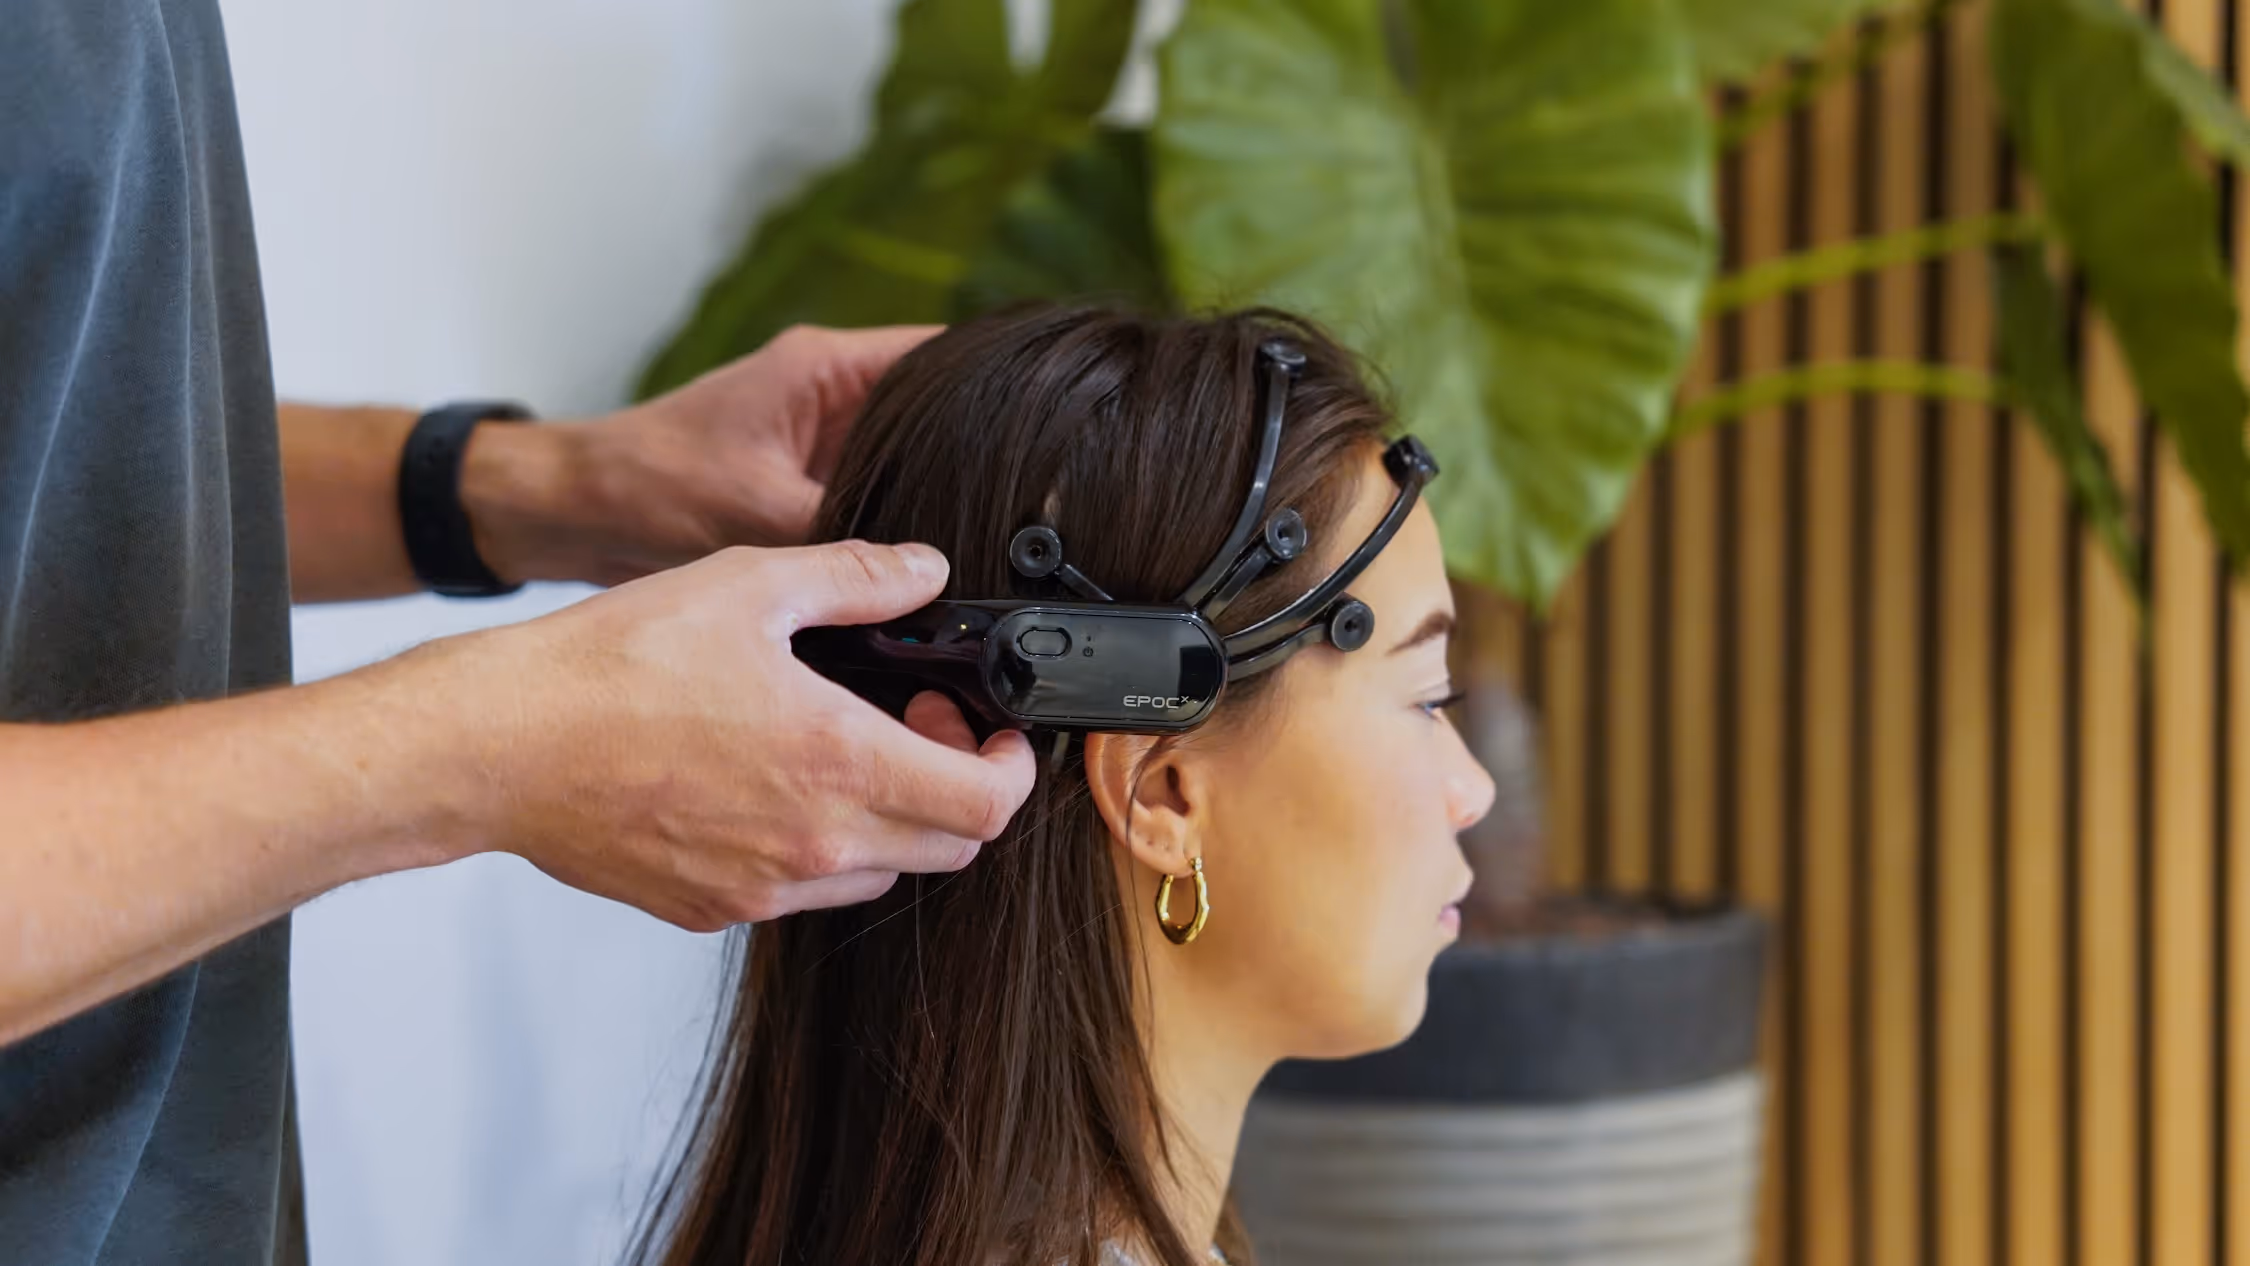
- Eye-tracking and EEG
Eye-tracking shows where attention goes, or what gets missed. EEG measures brain activity. Together they reveal what users feel, not just what they do.
- Where the difference lies
We see exactly where you score stronger or weaker than your competitor. Not as an average across the whole site, but per step in the journey.
A benchmark made to measure
With a Custom Benchmark you decide everything. Which competitors you compare, which flow participants go through and which questions you want answered. So you measure exactly what matters for your strategy.
You can benchmark against one competitor or ten. The lead time is similar to a regular Neuro UX Test: a few weeks.
Book an intro call
Open Benchmark
We compare the top 8 players in a market in exactly the same way. The same participants, the same tasks, the same measurements. So you get an objective comparison between you and your competitors.
- HealthcareThis summer
The first sector we map out in full. Join in and discover how you score in healthcare.
- EnergyLater in 2026
Players from the energy sector, measured the same way. Discover where the experience wins or loses.
- RetailLater in 2026
Players from the retail sector, measured the same way. Discover where the experience wins or loses.
How does it work?
1. We define the benchmark setup together
Which competitors do we compare? Which flow do participants go through? What do you want to find out? Together we set the scope.
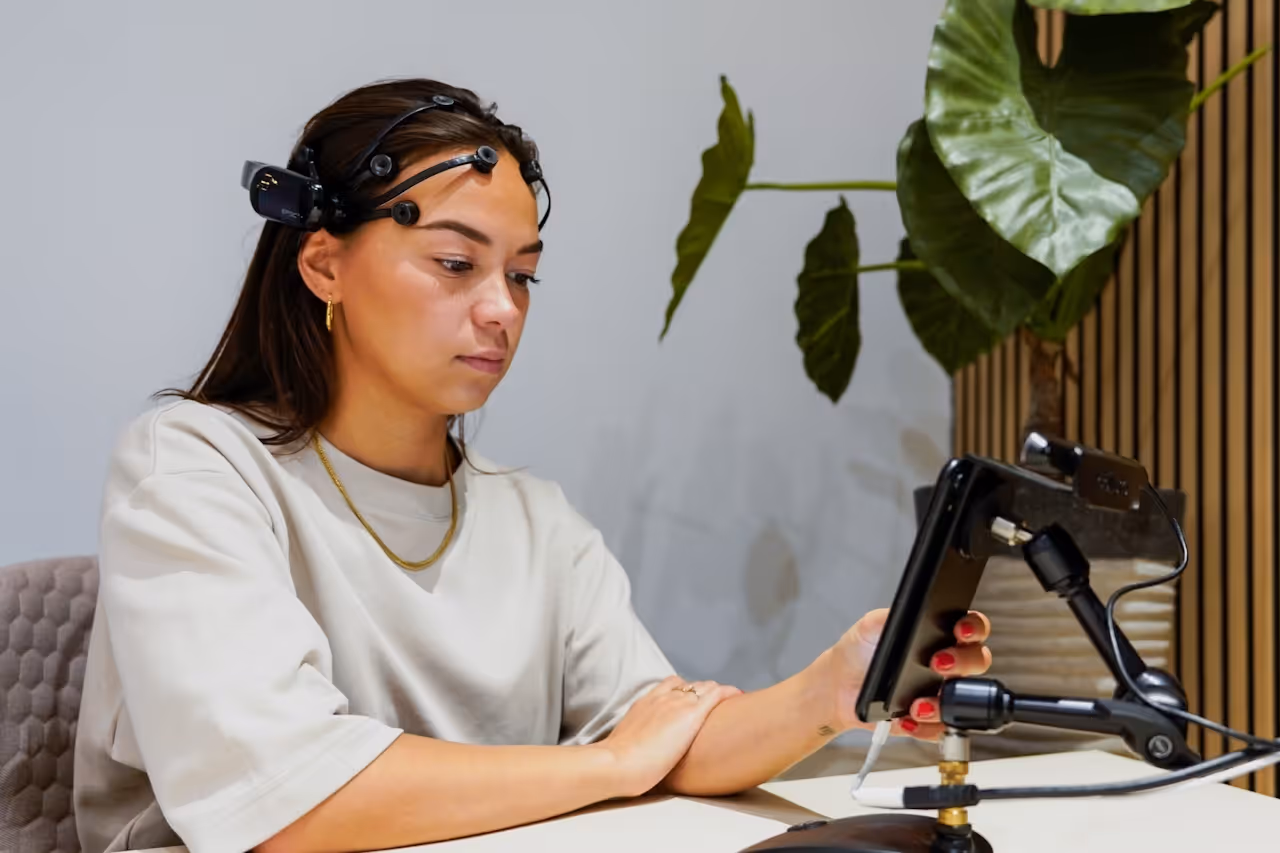
2. Participants go through every site the same way
Every participant gets the same task, in the same way. So the results are fairly comparable between you and your competitors.
3. We measure attention, load and frustration per step
EEG and eye-tracking show what users feel, not just what they do. Our researchers follow live where the difference lies.

4. You get a clear report: who scores on what, and why
Concrete insights per step in the journey, with practical advice. Ready to apply in your digital product.

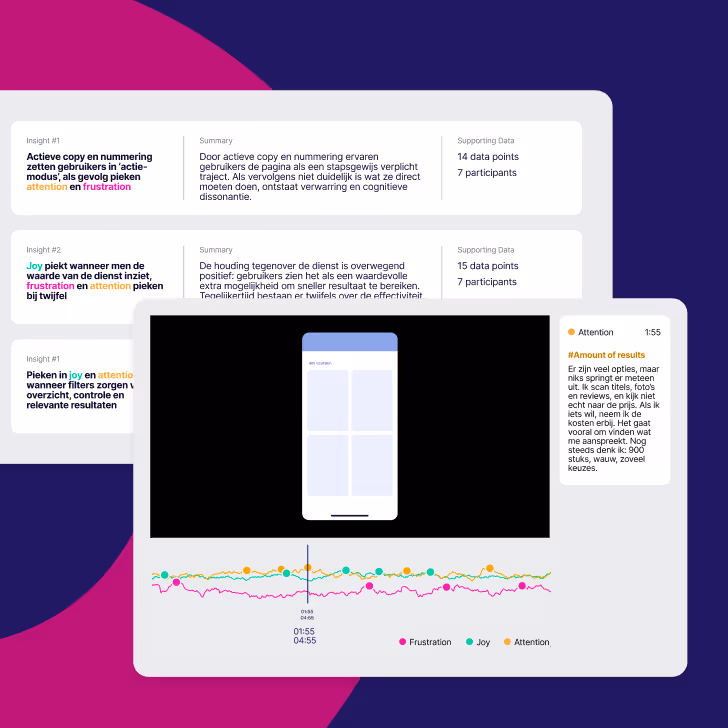
From EEG data to UX Metrics
Our researchers turn it into clear insights, with psychological grounding and optimisations you can apply straight away. Every insight, recording and data point lives in our platform Brainpeek.
- Joy
We get to see which moments felt good for the user.
- Attention
We measure the mental effort it takes to use the site or app.
- Frustration
We see the frustration. That is how we find sticking points and can predict drop-off.


Want to know where you stand, compared with your competitors?
Our researchers are ready.